
Issue reports and logs
Preserve the current evidence, reproduce the problem once, collect the relevant logs, and report it at Digital IDE Issues. Explain the action, expected result and actual result, with output from before and after the failure.
Reporting workflow
- Record Digital IDE, VS Code, OS and relevant tool versions. Specify local or Remote SSH execution and the affected feature.
- Save current Output before clearing it, reloading the window or deleting build directories. Export crash evidence if the backend exited unexpectedly.
- Search Issues using the error text or feature name. Add evidence to an existing matching issue; report unrelated problems separately.
- Reproduce once with explicit steps and an operation time. Provide a small shareable project, or the commit, entry point and changes used in the plugin test project.
- Submit steps, expected/actual results, Output, configuration and necessary files. Include error text alongside screenshots.
- When testing a proposed fix, state the version, whether it still reproduces and the new logs.
You do not need to prove it is a plugin bug before reporting. Describe the evidence even if the cause may be HDL, a tool or the extension.
Get Output logs
Open the panel
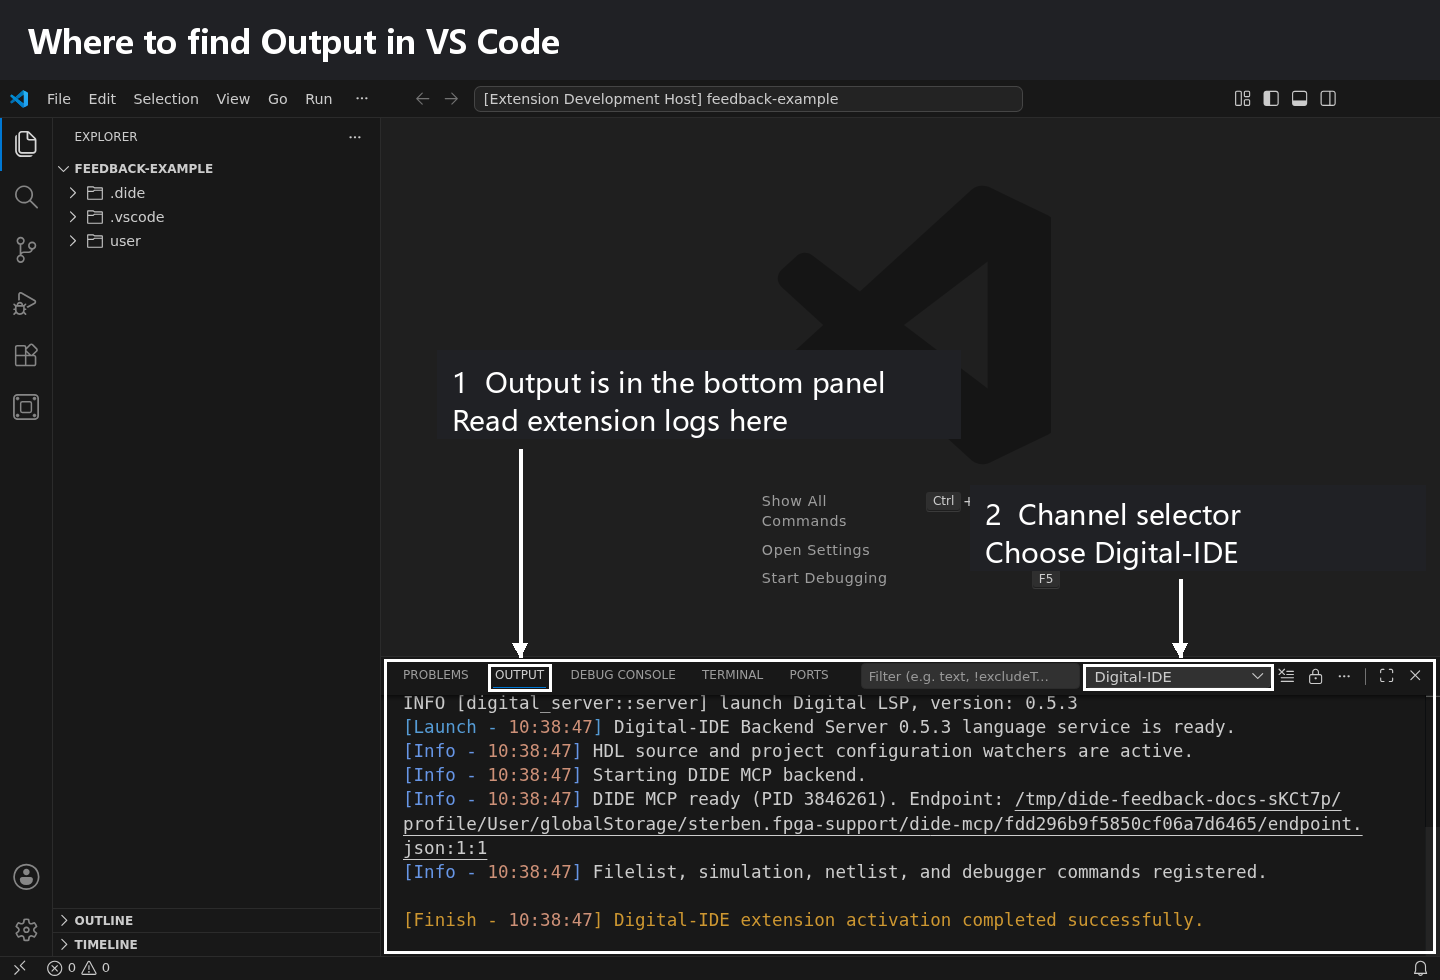
In the default layout, Output is at the bottom of the VS Code window, alongside Problems, Debug Console and Terminal. The full-window screenshot below outlines the entire Output panel: 1 points to the Output tab and log area; 2 points to the channel selector at the panel's upper right.
Choose View → Output, or open the command palette and run View: Toggle Output. Select a Digital-IDE channel from the panel's channel selector.
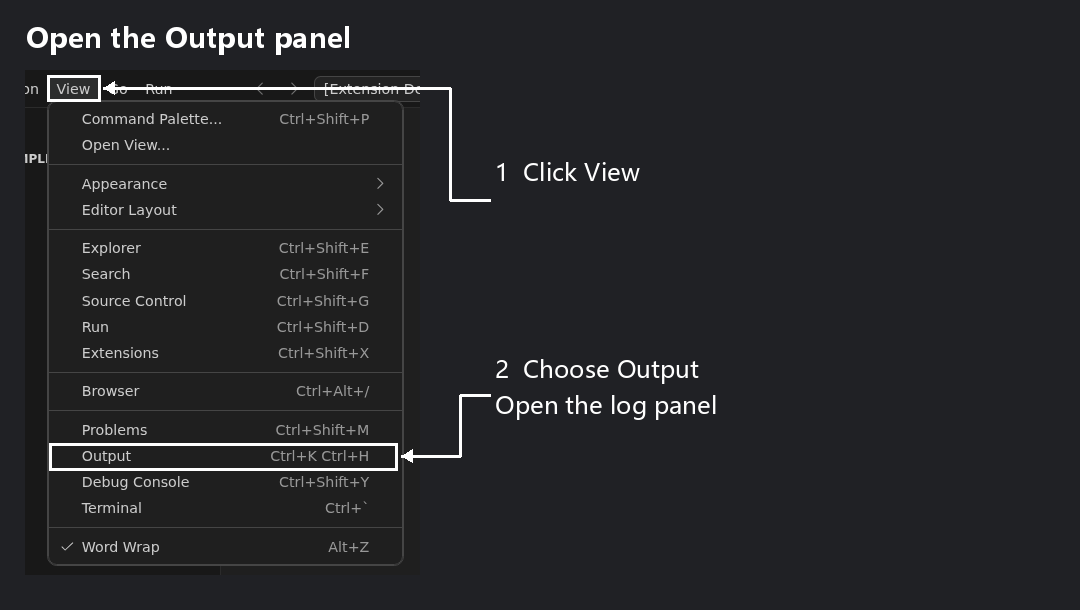
The white boxes and arrows mark View and Output in order. These screenshots show Digital IDE 0.5.3 in an isolated Linux development session with English VS Code. Menu and command labels vary with the interface language. Click an image to enlarge it.
| Panel | Contents | What to include |
|---|---|---|
| Output | Extension startup, tool invocation, task progress and errors. | The primary execution log. |
| Problems | Source diagnostics with file, line/column, code and message. | Include diagnostic text and relevant HDL for language issues. |
| Terminal | Commands, scripts or programs run in a terminal. | Include the command, working directory and output when relevant; it does not replace extension Output. |
Select the channel
The current implementation has four channels. Collect multiple channels when a problem spans features, and label each file.
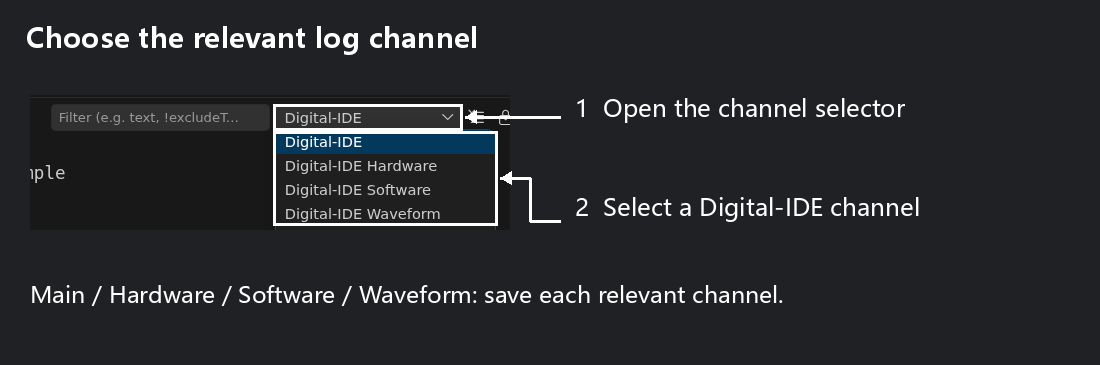
Open the selector marked 1, then choose a channel from the group marked 2. The log area shows only the selected channel. Switch and copy each relevant channel separately.
| Channel | Main contents | Typical problems |
|---|---|---|
Digital-IDE | Extension/backend startup, workspace and paths, language services, project operations, fast simulation and netlists. | Missing completion/navigation, hierarchy problems, server startup, fast simulation or netlist failures. |
Digital-IDE Hardware | HARD actions, vendor hardware output, task results and hardware manager/debugger backend errors. | Vivado/Efinity launch/builds, SRAM/Flash programming and ILA/VIO. |
Digital-IDE Software | SOFT actions, XSCT/processor software flow and related backend errors. | Software projects, builds, ELF download and processor debugging. |
Digital-IDE Waveform | Waveform file loading, backend connection, Webview handshake and renderer lifecycle/errors. | Blank panels, load failures and waveform interaction. |
For a blank waveform after fast simulation, collect Digital-IDE and Digital-IDE Waveform. For failed display after ILA capture, collect Digital-IDE Hardware and Digital-IDE Waveform. For missing completion, start with the main channel.
Copy and save
- Select a channel and focus its log text. Use
Ctrl+A,Ctrl+C(Cmd+A,Cmd+Con macOS) to copy its current output. - Paste into a text file named after the channel, such as
digital-ide.log,hardware.log,software.logorwaveform.log. - Save old output before optionally clearing it for another reproduction. For startup failures, run Developer: Reload Window after saving to capture startup again. Otherwise, repeat the failing action.
- Copy the new output, including invocation, paths and task information before the first relevant error, and the final failure/exit result afterward.
Output is displayed per channel; if a vendor or simulator tool logs a specific .log or report file path, attach that file as well.
If channels are missing, check extension enablement and execution host. Use Developer: Show Logs… → Extension Host; remote failures may need remote extension-host logs. State explicitly that the expected channels were absent.
Understand the log messages
Extension format
Wrapped messages generally use [Category - HH:MM:SS] message:
[Launch - 10:20:30] Starting Digital Server language client.
[Path Check - 10:20:30] Digital Server executable: /opt/dide/digital-server
[Launch - 10:20:31] Digital-IDE Backend Server language service is ready.
These are format examples; wording, language and paths vary. Times establish ordering; include timezone when correlating machines.
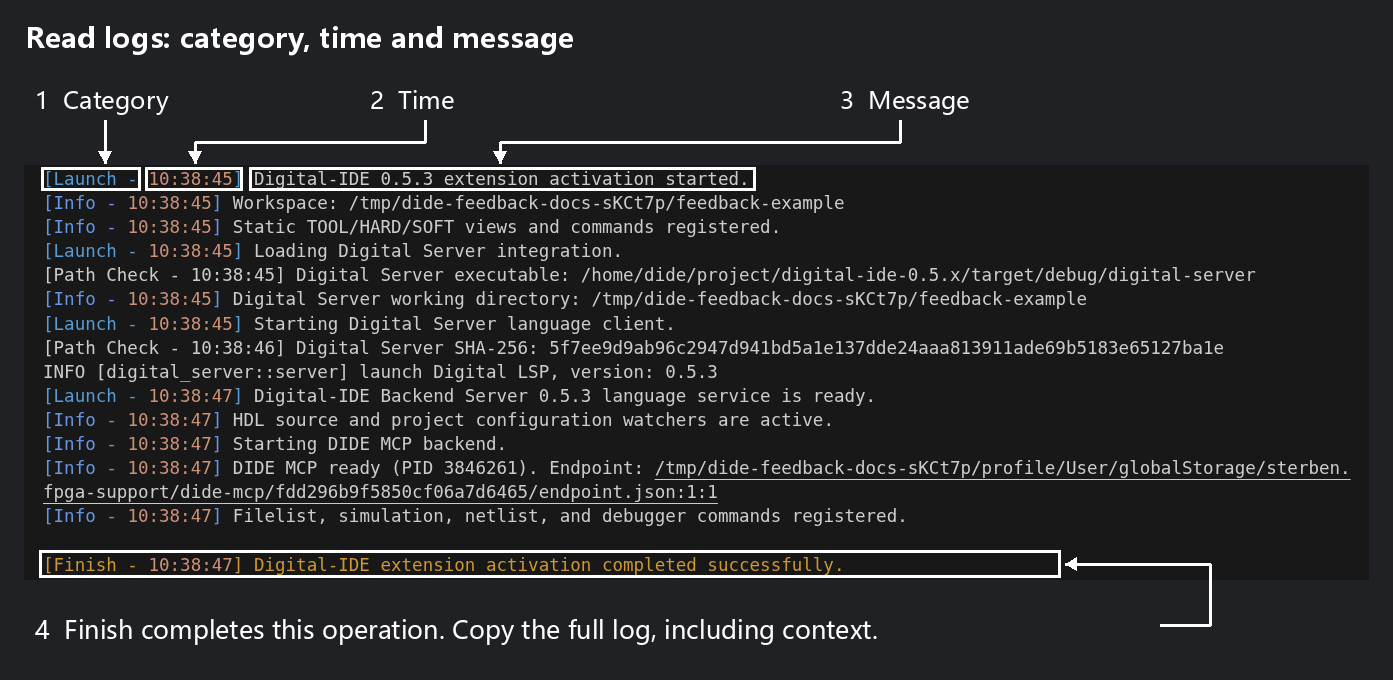
Labels 1–3 identify the category, time and message, and 4 marks extension activation completing. To save logs, focus the text and press Ctrl+A, Ctrl+C so the full context is preserved.
| Category | Meaning | Interpretation |
|---|---|---|
Launch | Starting a service, tool or panel. | Look for a subsequent ready/success/failure message. |
Path Check | Executable/resource paths or file fingerprints. | Identifies the executable or resource file used. |
Info | General state, configuration, output paths or normal tool messages. | Keep it for context. |
Run | Starting, advancing or waiting within an operation. | Report how long it waited and the last message. |
Performance | Timing/performance measurements. | Include project size, duration and execution environment. |
Debug | Additional diagnostic details. | Not an error; default Output may omit debug information. |
Warn | Warnings, cancellation, deprecation or other concerns. | Read the message and final result; warnings do not necessarily mean failure. |
Error | A step or operation reported an error. | Find the first relevant error for that operation and check the final exit status. |
Finish | A specific operation completed. | Indicates that the corresponding step or subtask finished. |
Some tool output is unwrapped. Categories are inferred from source/text; read the original diagnostic and task result too. A subprocess's stderr stream may carry warnings or normal diagnostics, so it is not automatically a failed operation.
Backend format and task IDs
Backend messages may look like:
ERROR [digital_server::some_module] detailed diagnosticERROR, WARN and INFO are levels, and digital_server::… identifies the backend module. Output forwards backend warnings, errors and key startup messages; provide additional logs if requested by maintainers.
| Marker | Purpose |
|---|---|
[request …] | Frontend operation request, such as one Build. |
[task …] | Backend task ID linking progress, output and final result. |
[phase] | Task phase, such as failed; values depend on the action. |
| Final status | Indicates success, failure or cancellation together with the result message. |
kind: path | Returned artifact path (verify that the file timestamp matches the current run). |
Preserve request/task IDs, especially when operations overlap.
Common messages
| Message or symptom | Likely meaning | Include |
|---|---|---|
language service is ready | Language client startup completed. | HDL, language mode/configuration and later parsing errors. |
ENOENT / file not found | Missing executable, input or invocation dependency. | Full error, resolved path, host and tool settings. |
EACCES / Permission denied | Access/execution permissions failed. | OS, path and invocation. |
GLIBC… not found / shared libraries | Runtime compatibility or missing system dependency. | Original startup error, OS/architecture and backend version. |
Vendor ERROR / CRITICAL WARNING | A vendor tool diagnostic; severity requires the specific message. | Diagnostic ID/context, tool version, device/top and constraints. |
Vivado Tcl lines beginning with # | Often script echo; the word error in the script is not necessarily an emitted error. | Actual later ERROR messages and task result. |
timeout / waiting for Webview ready | Connection/handshake did not complete in time. | Duration, main/Waveform output, remote setup and steps. |
Digital Server crashed… / panic | Backend abnormal exit/runtime failure. | Previous action, main output and crash evidence below. |
Export backend crash evidence
If the backend exits and multiple features stop working, save Output and run these command-palette actions:
- Digital-IDE: Open Latest Server Crash Evidence opens the latest evidence directory.
- Digital-IDE: Export Latest Server Crash Evidence exports ZIP on Windows. The current non-Windows implementation opens the directory; archive or retrieve it using the host/remote file tools.
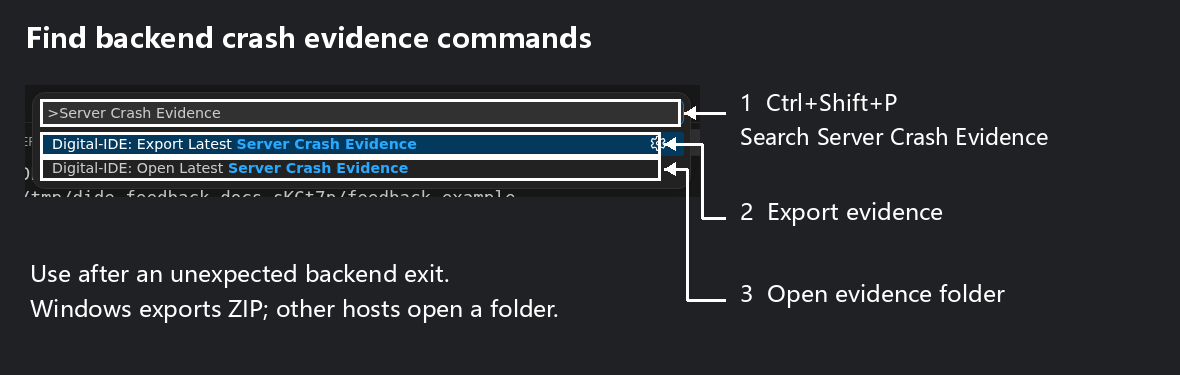
1 marks the search field, 2 the export command and 3 the open-folder command.
Evidence belongs to the extension execution host's global storage, not necessarily the project. If Remote SSH cannot reveal the directory locally, retrieve it from the remote host using the logged path.
| File | Meaning |
|---|---|
manifest.json | Versions, host/workspace, exit code/signal and failure classification. |
server.stderr.log | Raw backend stderr, including context omitted from Output. Size-limited and may show truncation. |
activity.jsonl | Recorded activity and exit events in time order. |
workspace-files.json | HDL file inventory, sizes and hashes collected in certain crash scenarios. |
sha256sums.json | Evidence integrity information. |
crash-event.json, monitor.log, digital-server.dmp | Platform-specific monitoring records and crash dump files. |
digital-ide.function.lsp.crashForensics.enabled defaults to true. Retention has session-count, total-size and age limits: retrieve evidence promptly. Normal shutdown may leave none. If no evidence is available, submit Output and reproduction steps anyway. Ordinary compiler errors are not backend crashes and do not require full-memory dumps.
Before sharing, review account paths, server addresses, credentials and source/memory contents. Redact consistently while retaining error IDs and relative path relationships. Use a small shareable reproduction when the full project is private.
Materials for each issue type
| Problem | Useful attachments |
|---|---|
| Language services/hierarchy | Main output, minimal HDL/dependencies, language standard, configuration, diagnostics and .dideignore. |
| Fast simulation/netlist | Main output, top/testbench, simulator/synthesis version, arguments and generated logs; Waveform output for display failures. |
| HARD build/program/debug | Hardware output, original vendor logs, tool version, part/top/constraints, connection and artifacts used. |
| SOFT/processor debug | Software output, Vitis/XSCT/GDB versions, processor, hardware handoff and ELF origin; relevant terminal/debug-console errors. |
| Waveform | Waveform output, small reproducing waveform/DWS, steps and screenshot; source simulation/capture channel when relevant. |
| Backend exit | Main output, crash evidence, last action and reproduction files. |
At Issues, choose New issue and use the repository's current template. If none fits, use the outline below. Submit unrelated problems separately with a feature/action/symptom title.
Title: [Feature] Specific symptom after an action

### Environment
- Digital IDE version (release/development):
- VS Code version:
- OS and architecture:
- Local or Remote SSH (remote OS and extension execution host):
- Relevant tools and versions:

### Reproduction
1. Project/file opened (test repository commit if applicable)
2. Selected top and command
3. Action immediately preceding failure

### Expected and actual results
- Expected:
- Actual:
- Frequency and wait duration:

### Attachments
- Output channels and operation time:
- Logs from operation start through failure:
- Configuration, minimal HDL/waveform and screenshots:
- For backend crashes: evidence or reason it could not be retrieved
If you cannot yet reduce the project, submit the logs, configuration and clear steps, and state which files cannot be shared. Root-cause analysis is not a prerequisite for reporting.